The majority of all hydrogen gas produced in the world today is produced from hydrocarbons, by, e.g., reforming of natural gas, fossil fuel or biomass. The result of this process is not pure hydrogen, but rather a gas mixture, referred to as reformate. In addition to hydrogen, the mixture typically contains nitrogen (N2), carbon dioxide (CO2), water and carbon monoxide (CO). It can also contain various other impurities, such as H2S, NH3 and hydrocarbons. Some of these impurities are highly poisonous to the catalyst of the fuel cell, while others are have a moderate effect or are more or less harmless. In order to optimise the purification procedure, knowledge of how and to what extent the presence of different impurities in the hydrogen feed gas affects the performance of the fuel cell is important. Using mass spectrometry combined with electrochemical techniques, such as stripping cyclic voltammetry, electrochemical impedance spectroscopy, potentiostatic and galvanostatic experiments, gives us information on not only on how the cell performance is affected, but an indication of why.
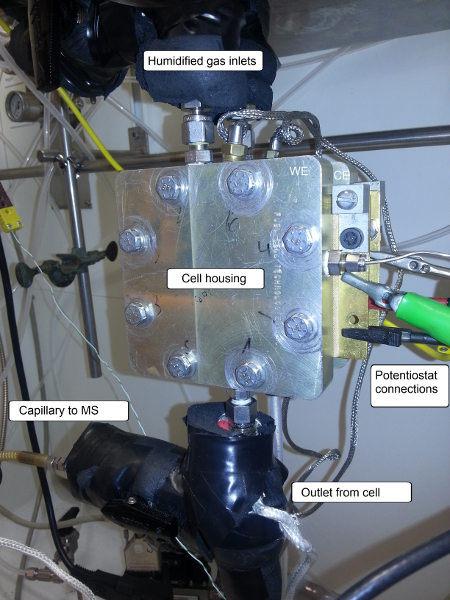
Figure 1: Cell Housing
Using ethene as an example, three different CVs are depicted in the top graph of figure 1a); a base CV, recorded in inert gas, a CV recorded in a continuous flow of 100 ppm ethene contaminated argon, and a stripping CV, where the electrode has been exposed to ethene contaminated argon for some time followed by purging the system prior to recording the CV. The origin of the differences between the different CVs can be interpreted with the aid of mass spectrometry. The measurements were made with a Hiden (HPR-20 QIC) Mass Spectrometer and a PAR 273A potentiostat.
Figure 2a), bottom, shows the m/z = 44 signal attributed to CO2, which corresponds nicely with the oxidation peaks around 0.6 V (30 s and 145 in the continuous case) indicating that adspecies originating from ethene are oxidised to CO2 at potentials > 0.35 V vs RHE. In figure 2b) we can see the signals m/z = 15 and 30 appear around the hydrogen evolution peak, indicating the formation of methane and ethane at these low potentials.
The presence of hydrogen, either in gas phase or adsorbed on the surface in the ethene contaminated gas was found reduce the amount of adspecies formed on the catalyst surface. Therefore, traces of ethene in the hydrogen feed were found to have a minimal effect on the performance of PEM fuel cell.
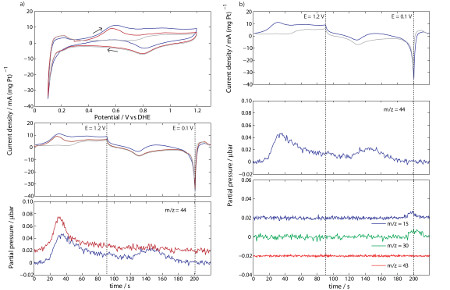
Figure 2: Cyclic Voltammograms recorded in a fuel cell at 80°C and 90%RH, at a scan rate of 10 mV s-1 and selected m/z signals. Colour codes: CVs recorded in pure argon (grey), 100 ppm ethene/argon (blue), stripping CV (red) after 10 min adsorption of 100ppm ethene at 0.3 V and. All three signals in b) bottom are recorded in 100 ppm ethene/argon. Data from ref. [1].
[1] K Kortsdottir, R W Lindström, and G Lindbergh. Int. J. Hydrogen Energy, 38(1):497 – 509, 2013.
Project summary by: Katrin Kortsdottir, Applied Electrochemistry, KTH-Royal Institute of Technology, Teknikringen 42, 10044 Stockholm, Sweden
Paper Reference: K. Kortsdottir, R. W. Lindström, G, Lindbergh (2013) “The influence of ethene impurities in the gas feed of a PEM fuel cell” International Journal of Hydrogen Energy 38 (1), 497-509
Hiden Product: HPR-20 QIC R&D Real time Gas Analyser
Read Full Article: Customer Research Review : Gas reaction studies & catalysis research [issue : 1120/10]