Batteries based on sodium superoxide and on potassium superoxide have recently been reported1, 2, 3. However, there have been no reports of a battery based on lithium superoxide (LiO2), despite much research4, 5, 6, 7, 8 into the lithium–oxygen (Li–O2) battery because of its potential high energy density. Several studies9, 10, 11, 12, 13, 14, 15,16 of Li–O2 batteries have found evidence of LiO2 being formed as one component of the discharge product along with lithium peroxide (Li2O2). In addition, theoretical calculations have indicated that some forms of LiO2 may have a long lifetime17. These studies also suggest that it might be possible to form LiO2 alone for use in a battery. However, solid LiO2 has been difficult to synthesize in pure form18 because it is thermodynamically unstable with respect to disproportionation, giving Li2O2 (refs 19, 20). Here we show that crystalline LiO2 can be stabilized in a Li–O2battery by using a suitable graphene-based cathode. Various characterization techniques reveal no evidence for the presence of Li2O2. A novel templating growth mechanism involving the use of iridium nanoparticles on the cathode surface may be responsible for the growth of crystalline LiO2. Our results demonstrate that the LiO2 formed in the Li–O2 battery is stable enough for the battery to be repeatedly charged and discharged with a very low charge potential (about 3.2 volts). We anticipate that this discovery will lead to methods of synthesizing and stabilizing LiO2, which could open the way to high-energy-density batteries based on LiO2 as well as to other possible uses of this compound, such as oxygen storage.
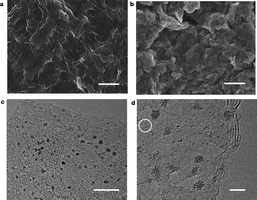
Figure 1 | Morphology of Ir–rGO. a, SEM image of pristine rGO powder. b, SEM image of Ir–rGO composite. c, d, TEM images of Ir-rGO composite, showing Ir nanoparticles less than 2 nm in size. The circle in d shows some small Ir atomic clusters. Scale bars: a, b, 1 μm; c, 10 nm; d, 2 nm. There are also some scattered large Ir agglomerates on the rGO (see Supplementary Fig. 1).
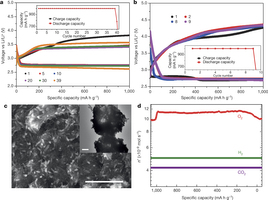
Figure 2 | Electrochemical tests and discharge products. a, Voltage profiles of the Ir–rGO cathode (see also Supplementary Fig. 6). Cycle number of voltage plot is given by the colour of the plotting symbol (see key). Inset shows capacity as a function of cycle number. b, Voltage profiles of the rGO cathode. Cycle number of voltage plot is given by the colour of the plotting symbol (see key). Inset shows capacity as a function of cycle number. c, Main panel, SEM image of discharge product on Ir–rGO (scale bar, 1 μm); inset, TEM image of discharge product on Ir–rGO (scale bar, 200 nm). Both main panel and inset are from the first discharge with a current density of 100 mA g−1, and capacity control of 1,000 mAh g−1. d, DEMS profile showing O2, H2 and CO2 gases released (n′ is the number of moles per second) from the cell during the charging process (at 1,000 mA g−1 current density) after the first discharge (at 100 mA g−1 current density) to 1,000 mA h g−1 capacity (see Supplementary Information for details).
Nature 529, 377–382 (21 January 2016) doi:10.1038/nature16484
Received 01 October 2014 Accepted 13 November 2015 Published online 11 January 2016
Jun Lu, Yun Jung Lee, Xiangyi Luo, Kah Chun Lau, Mohammad Asadi, Hsien-Hau Wang, Scott Brombosz, Jianguo Wen, Dengyun Zhai, Zonghai Chen, Dean J. Miller, Yo Sub Jeong, Jin-Bum Park, Zhigang Zak Fang, Bijandra Kumar, Amin Salehi-Khojin, Yang-Kook Sun, Larry A. Curtiss & Khalil Amine
View Article Online : Click here
Visit Product Page : HPR-40 DSA
Make an enquiry : Send us a message