Although tremendous efforts are made in developing stable Zn electrodes and bifunctional catalysts in rechargeable Zn–air batteries, the charging process is seldom reported. Herein, an in-depth investigation into the gas evolution on the air electrode is conducted by in-situ characterization. It is found that the charging process can be divided into three stages: no obvious bubbles, small bubbles owing to the oxygen evolution, and large bubbles owing to oxygen evolution and carbon corrosion. The post analyses illustrate that the severe bubble formation can deteriorate the electrochemical performance of the air electrode. With the catalyst loading increases, the bubbles on the surface become smaller and sparser. At low current densities, the air electrode can keep “self-clean” from bubbles, which is the ideal state for the charge. Whereas with an increase of the current density, the large-bubble stage is enlarged, and more bubbles are attached to the surface, leading to extra charge impedance. As the extent of discharge/charge reduces, the three stages disappear, and only small bubbles can be found on the surface, which is favourable for the stable operation. This work provides a profound understanding of the charging behaviors on the air electrode, facilitating the development of high-performance Zn-air and other metal-air batteries.
The structure of the battery and the in-situ optical platform are illustrated in Fig. 1a. The battery contains a zinc plate electrode, an alkaline electrolyte, and an air electrode. Fig. 1b displays the voltage curves at 10 mA cm-2 for discharging and 70 mA cm-2 for charging. In the beginning, the surface of the catalyst layer can be clearly observed, and no obvious bubbles can be found on the surface. Then, oxygen continues to accumulate until it reaches saturation and begins to nucleate and appear on the surface of the electrode in the form of small bubbles. Meanwhile, the contact between the two-phase interfaces begins to strengthen, resulting in a slight decrease of the charge voltage. Further, large bubbles (0.3-1.8 mm) begin to generate on the surface with dark brown stripes appear in the electrolyte. As the charging progresses, more and more carbon is corroded. Correspondingly, the electrode surface is partially covered with small O2 bubbles and large CO bubbles. In addition, the organic stripes in the electrolyte become darker and show more obviously.
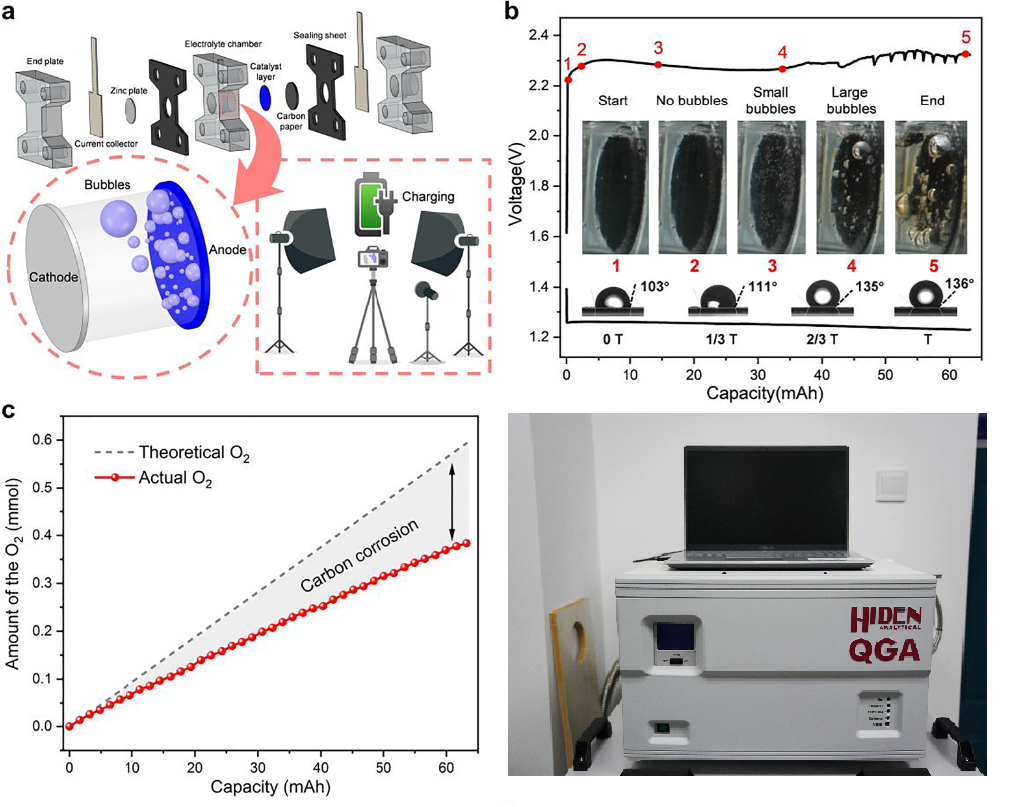
Figure 1
The quantitative gas analysis during charging was carried out by Hiden QGA. The theoretical amount of the oxygen production during charging is obtained from the Faraday’s law of electrolysis. According to the measurement results, the theoretical and actual amount of O2 during charging are shown in Fig. 1c. The theoretical amount of O2 after the charge is calculated to be 0.594 mmol. However, only 0.384 mmol is actually produced with the proportion of 65%, and the other 35% is consumed by the carbon corrosion. The rate of the O2 production, obtained by taking the derivative of the actual amount of O2 production curve, gradually decreases as the charge progresses, indicating that the OER becomes worse, while carbon corrosion is promoted.
![]() Project summary by: Peng Tan, Department of Thermal Science and Energy Engineering, University of Science and Technology of China, Hefei 230026, Anhui, China
Project summary by: Peng Tan, Department of Thermal Science and Energy Engineering, University of Science and Technology of China, Hefei 230026, Anhui, China
Paper Reference: Yi He, et al. (2022) “In-Situ Observation of the Gas Evolution Process on the Air Electrode of Zn-Air Batteries during Charging” Chemical Engineering Journal, 427, 130862.
Hiden Product: QGA
To find out more about these products visit the QGA product page or if you would like to contact us directly please Send us a Message.